

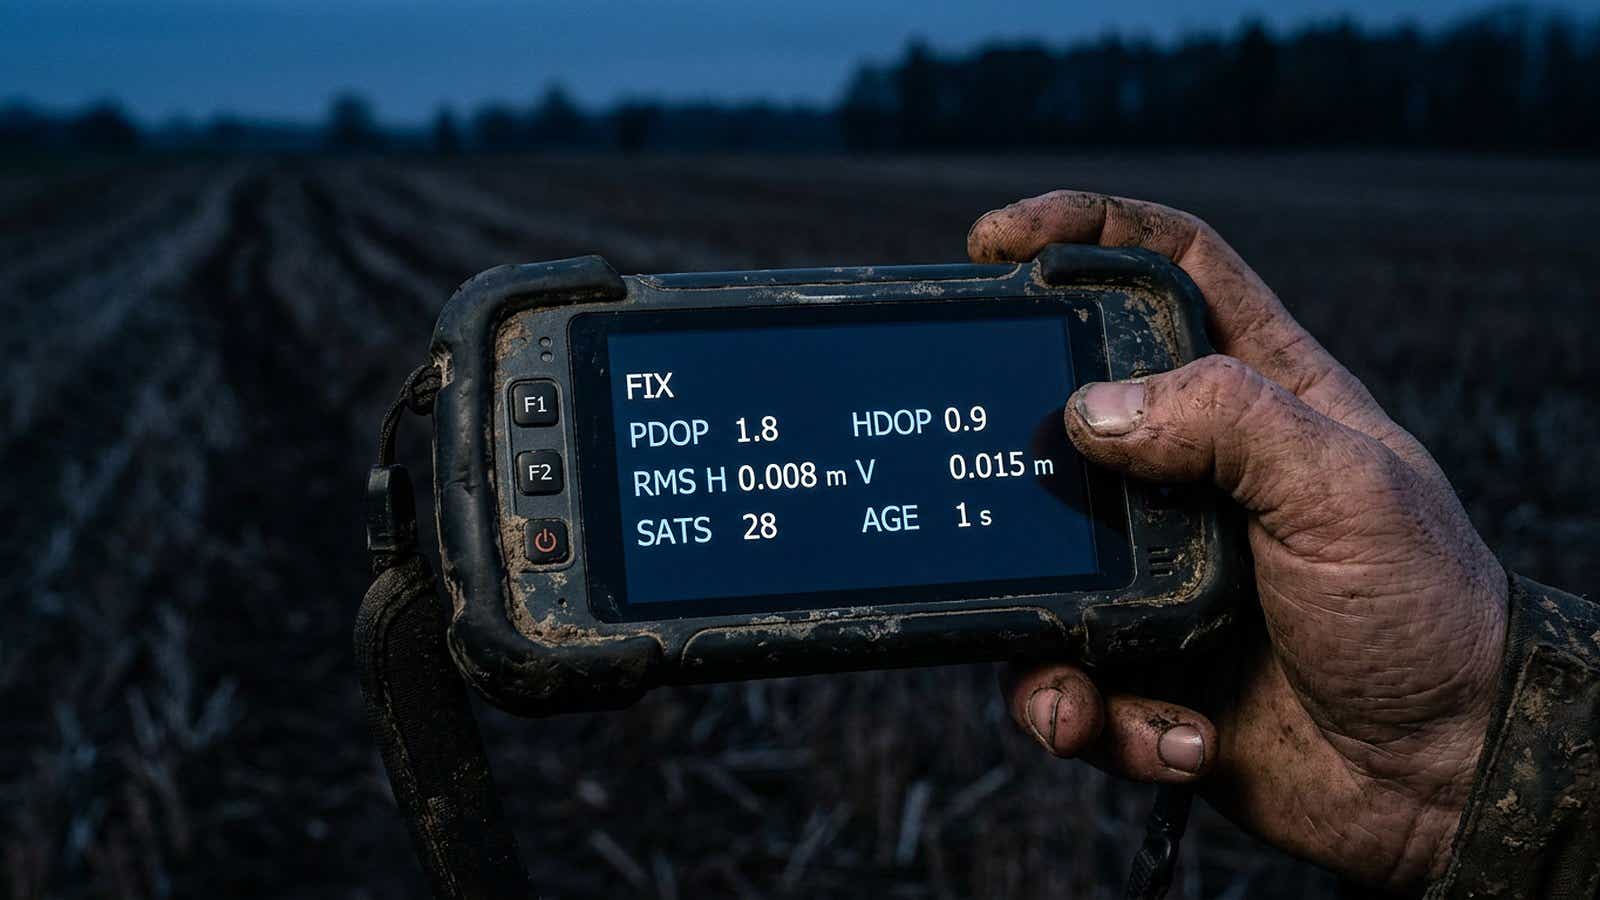
Your field software shows four numbers at once, and they do not always agree. A solution status, an accuracy estimate, and two geometry figures. Reading them in the wrong order is how a survey ends up with data that looked fine on screen.
Which number should you trust? Check solution status first, because fixed and float are different estimators rather than one estimator at two qualities. Then the accuracy estimate, once you know its confidence level. Geometry last, as a diagnosis of the first two.
- FIX / FLOAT: whether the receiver has resolved the carrier-phase ambiguities to whole numbers. Fixed is a centimetre-level solution; float is not.
- RMS: a statistical summary of how tightly your positions cluster. Horizontal one sigma covers about 39 percent of them, not 68 percent.
- HDOP: a dimensionless multiplier describing how satellite geometry inflates horizontal error.
- PDOP: the same idea in three dimensions, combining the horizontal and vertical figures.
- The rule: status first, then the accuracy estimate, then geometry. Each is only readable in the light of the one before it.
- When they disagree, the geometry figure is usually the one misleading you.
By Konstantin Nidens, CEO and Co-Founder, RTKdata
RTK fix vs float: the status that overrides everything else
What FIX and FLOAT actually mean
A carrier-phase measurement is precise but ambiguous: it contains an unknown whole number of wavelengths. Resolving that number is what NovAtel calls the key to unlocking the highest-accuracy GNSS positions (retrieved September 2026). Until it is, the receiver estimates the ambiguities as real numbers, and NGS puts it plainly: that decimal cycle count "is said to be the float solution, one that still has not yet forced the number of whole cycles to take an integer value".
The two states are not two grades of one answer. Your rover announces which is running: u-blox documents quality indicator 4 as RTK fixed and 5 as RTK float in the GGA sentence (retrieved September 2026), alongside the satellite count and the HDOP GPS receivers compute for that epoch.
Vendors quantify float differently. Septentrio says it converges "from several decimeters to several centimeters" over several minutes; Emlid puts it at "a few centimeters to about 1 meter". The shorthand that float means decimetre-level sits between the two and is not a specification either company publishes.
Why a good geometry number means little under float
Under float the ambiguities are unresolved, so the position is a converging estimate. The accuracy figure still describes something real, but NGS is careful about what: a data collector reports internal repeatability, and warns the display can show "false precision" when multipath is present. Tight numbers under float describe a receiver agreeing with itself, not with the ground, and geometry cannot settle it either way.
RMS: the statistic your software is quietly rounding
RMS and the confidence-level problem (CEP, HRMS, 2DRMS, R95)
Most arguments about GNSS accuracy are really arguments about confidence levels. The US Army Corps of Engineers is blunt: a "3-meter" accuracy statistic "is meaningless unless it is identified as being either 1-D, 2-D, or 3-D, along with the applicable probability or confidence level". A 2025 FIG paper prints the horizontal conversions (retrieved September 2026).
| Horizontal measure | Probability | Scale on one sigma |
|---|---|---|
| One sigma | 39.35% | 1.0 |
| CEP | 50% | 1.177 |
| DRMS, often shown as HRMS | 63.21% | 1.414 |
| R95 | 95% | 2.448 |
| 2DRMS | 98.20% | 2.835 |
Two traps live in that table. Horizontal one sigma is 39.35 percent, not 68 percent; the 68.3 percent figure belongs to the one-dimensional vertical case, and Frank van Diggelen listed the confusion as a named misconception, true "for only 1-D Gaussian distributions" (retrieved September 2026). And 2DRMS is not a flat 95 percent: it encloses 98 percent for a circular distribution and drifts toward 95 percent as the error ellipse elongates, which is what weak horizontal geometry does.
Why "1 cm" from two different receivers is not the same claim
Compare two datasheets. The u-blox ZED-F9P-04B quotes RTK horizontal accuracy of 0.01 m + 1 ppm CEP, vertical as Median (retrieved September 2026): both 50 percent statistics, so half your points fall outside. Trimble quotes its R12i RTK performance as RMS instead. The digits look alike; the promises do not. Van Diggelen's 2007 update adds the rule for unlabelled specifications: an accuracy quoted with no metric "is usually CEP".
One caveat applies here specifically. Van Diggelen notes differential and RTK errors over short periods are dominated by multipath and "distinctly non-Gaussian". Survey occupations are short, so these factors are least reliable exactly where this article is aimed: use them to compare specifications, not to convert your own observations.
HDOP and PDOP: what satellite geometry is telling you
HDOP vs PDOP vs VDOP, and PDOP² = HDOP² + VDOP²
Dilution of precision is a scaling factor drawn from satellite geometry and nothing else. Richard Langley defines it through the square root of the trace of the solution covariance matrix, whose elements "are a function of the receiver-satellite geometry only". The values are dimensionless, as u-blox states in its protocol specification, and lower is better.
The family splits by which part of that covariance you sum: horizontal takes the east and north terms, vertical the up term, and the position figure all three. That is why NOAA's National Geodetic Survey can print the identity as "PDOP² = HDOP² + VDOP²". Add the clock term for GDOP, take it alone for TDOP. The identity is exact only within one solution covariance in one local frame, so figures from different receivers will not reproduce it.
The relationship to error is equally conditional. The GPS Standard Positioning Service Performance Standard gives Accuracy = UERE x DOP, then calls it "a simple approximation" valid only when all pseudorange errors are zero mean, normally distributed and share the same UERE. Its outputs are RMS quantities. And it scales precision rather than accuracy: NGS words it "lower DOP values should indicate better precision".
What counts as a good value, and why the thresholds do not agree
There is no single answer, and the sources are not being careless. They gate different things.
| Source | What the limit is for | Value |
|---|---|---|
| NGS real-time class RT1 | 0.01 to 0.02 m horizontal, 7+ satellites | 2.0 |
| NGS real-time class RT2 | 0.02 to 0.04 m horizontal | 3.0 |
| NGS real-time class RT3 | 0.04 to 0.06 m horizontal | 4.0 |
| NGS real-time class RT4 | 0.1 to 0.2 m horizontal | 6.0 |
| GPS SPS Performance Standard | Constellation availability, 5 degree mask | 6 |
| USACE EM 1110-1-1003 | A reliable pseudorange solution | Under 6, optimally under 5 |
| Trimble Business Center glossary | Describing a good value | Under 3, above 7 is poor |
| Trimble Access | Default rover mask | 6 |
| u-blox ZED-F9, HPG 1.32 | Output validity filter | 25.0 |
The spread is not noise. NGS assigns a different ceiling to each accuracy class, the clearest published demonstration that the limit follows from the work. The 6 appearing everywhere else has other parentage: in the SPS Performance Standard it is a constellation-availability commitment covering 98 percent of the global average over a sidereal day, which says nothing about your point. Trimble brackets the disagreement by itself, its glossary calling anything above 3 not good while its field software ships a mask of 6, and the chip-level default is looser again because there the number is a validity flag, not a quality gate. If you have heard that 6 is the standard mask and 4 is for precision work, the first half describes Trimble Access and an old ArcPad rule of thumb; the second is field-training folklore, not a documented default anywhere we could find.
Why these four numbers can disagree with each other
Most guides stop at the warning not to conflate geometry with error. The more useful question, and the one that decides your GNSS accuracy in practice, is what a specific contradiction tells you.
Good DOP, bad RMS: what it means
A 2024 forest study is the cleanest published example. Under canopy with a four-constellation survey-grade receiver, the authors recorded about 13 visible satellites on average and a PDOP GPS surveyors would accept without hesitation, under 2. They still obtained no fixed solutions at all across 2,670 epochs, leaving the receiver in place for one to two hours at some points (retrieved September 2026). Horizontal accuracy came out at 2.03 m RMSE.
Nothing was wrong with the sky map. The signals were attenuated and contaminated by multipath, and the receiver could not hold carrier phase lock long enough to resolve ambiguities. Geometry describes where the satellites are, not whether their signals arrive intact. Teunissen and colleagues give the formal version: the position figure "works well for code-based positioning" but needs "great care" in RTK, because a small position figure can coincide with a large ambiguity figure, in which case ambiguity resolution will not be possible.
FIX solution, high PDOP: what it means
The reverse case is real too, and the same work notes a large position figure with a small ambiguity figure is not necessarily poor performance. But a fixed solution is not automatically correct. NovAtel documents the failure mode and ships a command for it: normally a fixed-integer solution is very accurate, "however, in some rarely-occurring situations, even a fixed-integer solution can become inaccurate; for example, if the DOP is high due to satellites not being visible". Its RTKINTEGERCRITERIA command reports such a solution as float instead. u-blox makes the same admission from the other side with a conservative ambiguity fix mode, trading a slower fix for "near absolute certainty when RTK is achieved" in urban surveying. A fast fix in a hard environment deserves suspicion.
A field decision framework
Work the numbers in order, and let each qualify the next.
- Solution status. Fixed or float, read as words rather than a numeric code. Under float, stop and fix the cause before recording anything you intend to keep.
- Correction age. A fixed solution on stale corrections is a fixed solution drifting. Our documentation puts full performance under one second of latency, with more float above one to three seconds.
- Accuracy estimate, with its confidence basis. Establish whether your software shows CEP, one sigma or 2DRMS before comparing it to a specification.
- Geometry. Read it last, as an explanation. Good geometry does not validate the numbers above it; poor geometry tells you which of them to distrust.
A worked case: a fixed solution, a correction age of two seconds, a horizontal figure of 0.008 m, and a PDOP GPS field software would flag as marginal at 5.4. Step one passes. Next, step two is the first thing to chase. Step three needs a check, because if that 0.008 m is CEP then the 95 percent figure is nearer 0.017 m, which may still meet your tolerance but is not what the screen implied. Finally, step four reads as a warning rather than a verdict, and argues for reoccupying the point.
Reverse it and the reading changes completely. A float solution with excellent geometry is not a good measurement with a small problem; it is a measurement whose ambiguities were never resolved, which is why what centimetre accuracy means in the field depends on solution status before anything else.
What degrades them, and why they rarely fall together
The intuition that a hard environment pushes all four indicators the same way is worth abandoning. The forest study kept good geometry and lost the fix entirely, because signal quality and geometry degrade through different mechanisms.
Satellite count sets the floor. u-blox states a single-constellation receiver needs at least 6 satellites with continuous phase lock above the elevation mask to attempt a fixed solution, 7 for GPS plus GLONASS, and 8 once BeiDou joins, so adding constellations helps most where the sky is restricted. Canopy then attacks the signal rather than the geometry: a ZED-F9P in Slovakia lost 4 to 5 dB-Hz of carrier-to-noise density moving from open ground to under canopy, while median multipath metrics roughly tripled. ESA's Navipedia names the RTK-specific consequence, that the method "needs continuity in the tracked measurements to avoid re-initialization of the phase-ambiguity filters", which obstructions repeatedly break.
This is where a mask earns or loses its keep. It rejects epochs on geometry alone, so it cannot catch a canopy failure where the geometry stayed good. It guards one failure mode; it is not a quality gate.
What corrections can and cannot fix
A correction stream removes the errors common to your rover and the reference station. ESA lists them: satellite clock bias, orbital error, ionospheric and tropospheric delay all cancel in differential processing. It is equally explicit that "the main errors left without correction are multipath, interference and receiver thermal noise".
That split explains the indicators. Corrections shorten convergence and tighten a fixed solution, and their benefit scales with baseline, which is why distance to the reference station drives GNSS accuracy and why our network RTK coverage assigns the nearest base. What they cannot do is clean up a reflected signal, and u-blox concedes the point by making its own accuracy specification conditional on antenna, multipath conditions and satellite visibility.
Age is the failure mode people miss. A u-blox rover stops using corrections older than 60 seconds by default and drops out of RTK, expressly "to prevent the computation of grossly misleading differential solutions". Our guidance is tighter: full performance under one second of latency, more float between one and three, meaningful loss beyond three. For hardware, our guide to choosing a GNSS receiver covers the tradeoffs, and RTK vs PPK covers real-time against post-processed workflows. The same four indicators apply whether you run RTK for surveying, RTK for drone mapping or RTK for robotics.
FAQ
What is a good PDOP value?
It depends on the accuracy you need. NOAA's National Geodetic Survey sets a different ceiling for each real-time class, from 2.0 for work at 0.01 to 0.02 m horizontal up to 6.0 for its loosest class at 0.1 to 0.2 m. Trimble Business Center calls anything under 3 good, Trimble Access ships a mask of 6, and the u-blox output filter defaults to 25.0.
What is a good HDOP for GPS?
The US Army Corps of Engineers puts typical performance for the horizontal figure in the 2 to 3 range, the vertical around 3 to 4. Treat that as normal conditions rather than an acceptance threshold: the HDOP GPS receivers report describes geometry only, and cannot tell you whether the arriving signals were clean.
What is the difference between RTK fix and RTK float?
A fixed solution has resolved the carrier-phase ambiguities to whole numbers and delivers centimetre-level relative accuracy; a float solution is still estimating them as decimals. Septentrio describes float converging from several decimetres to several centimetres; Emlid puts it at a few centimetres to about 1 metre. The receiver reports the state as quality indicator 4 or 5 in the GGA sentence.
Can you have a fixed solution with high PDOP?
Yes, and it deserves a second look. NovAtel documents that in rare situations even a fixed-integer solution can become inaccurate when geometry is poor because satellites are not visible, and ships a command that reports such solutions as float instead.
How do I convert DOP into accuracy in meters?
The GPS Standard Positioning Service Performance Standard gives accuracy as user equivalent range error multiplied by the relevant dilution of precision, but labels it a simple approximation holding only when all pseudorange errors are zero mean, normally distributed and share the same range error. The result is an RMS quantity, and it does not carry over cleanly to a carrier-phase RTK solution.
Is RMS the same as standard deviation?
Only when the mean error is zero, and only if you keep the dimensions straight. Horizontal one sigma is about 39.35 percent confidence; vertical one sigma is 68.3 percent, so the same phrase describes two different probabilities depending on the axis. Frank van Diggelen lists the assumption that RMS equals 68 percent as a misconception holding only for one-dimensional distributions.
Konstantin Nidens is CEO and Co-Founder of RTKdata, a global NTRIP correction service streaming centimeter-level GNSS positioning from more than 20,000 reference stations across 140+ countries to 10,000+ paying customers. He works daily with survey, drone, and robotics teams on receiver compatibility and correction delivery. LinkedIn